Debugging in VS Code
Debug C# Code
-
Create
.vscode/launch.jsonfile. -
Add the following content and change program value to your output file.
{"version": "0.2.0","configurations": [{"name": ".NET Core Launch (console)","type": "coreclr","request": "launch","preLaunchTask": "build",// TODO Change program value to your output file.// If you have changed target frameworks, make sure to update the program path.","program": "${workspaceFolder}/bin/Debug/net5.0/MyProgram.dll","args": [],"cwd": "${workspaceFolder}","console": "internalConsole","stopAtEntry": false}]} -
Create
.vscode/tasks.jsonfile. -
Add the following content and use your project file.
{"version": "2.0.0","tasks": [{"label": "build","command": "dotnet","type": "process","args": ["build",// TODO Change a value to your project file."${workspaceFolder}/MyProgram.csproj","/property:GenerateFullPaths=true","/consoleloggerparameters:NoSummary"],"problemMatcher": "$msCompile"}]} -
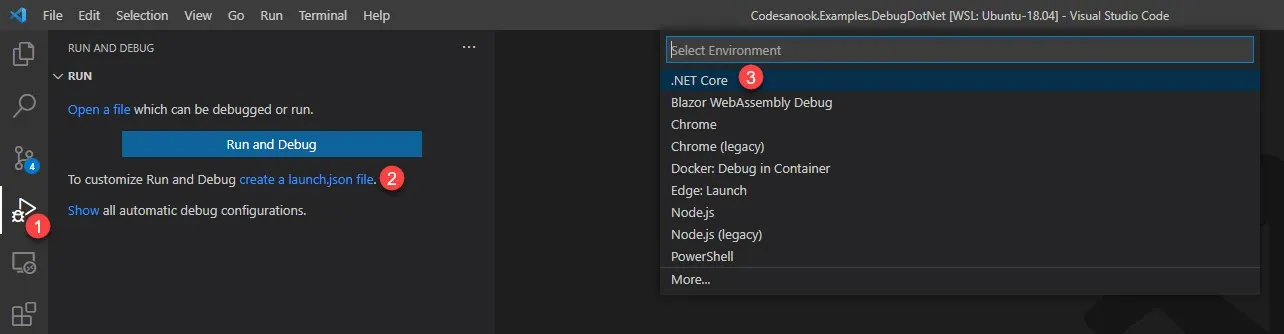
Alternatively you can use VS Code to generate launch.json and tasks.json.
- Click Debug icon.
- Click create a launch.json file.
- Click .NET Core.
-
Open a project with VS Code.
-
Put a breakpoint (F9) on a line that you want to pause a program and inspect value of a variable.
-
Start a program by pressing F5 or go to
Run > Start Debugging.- If you want to debug LINQ, put a cursor on Lambda expression and go to
Run > New Breakpoint > Inline Breakpoint. - You can also put a cursor on a lambda expression and press F9.
- If you want to debug LINQ, put a cursor on Lambda expression and go to
-
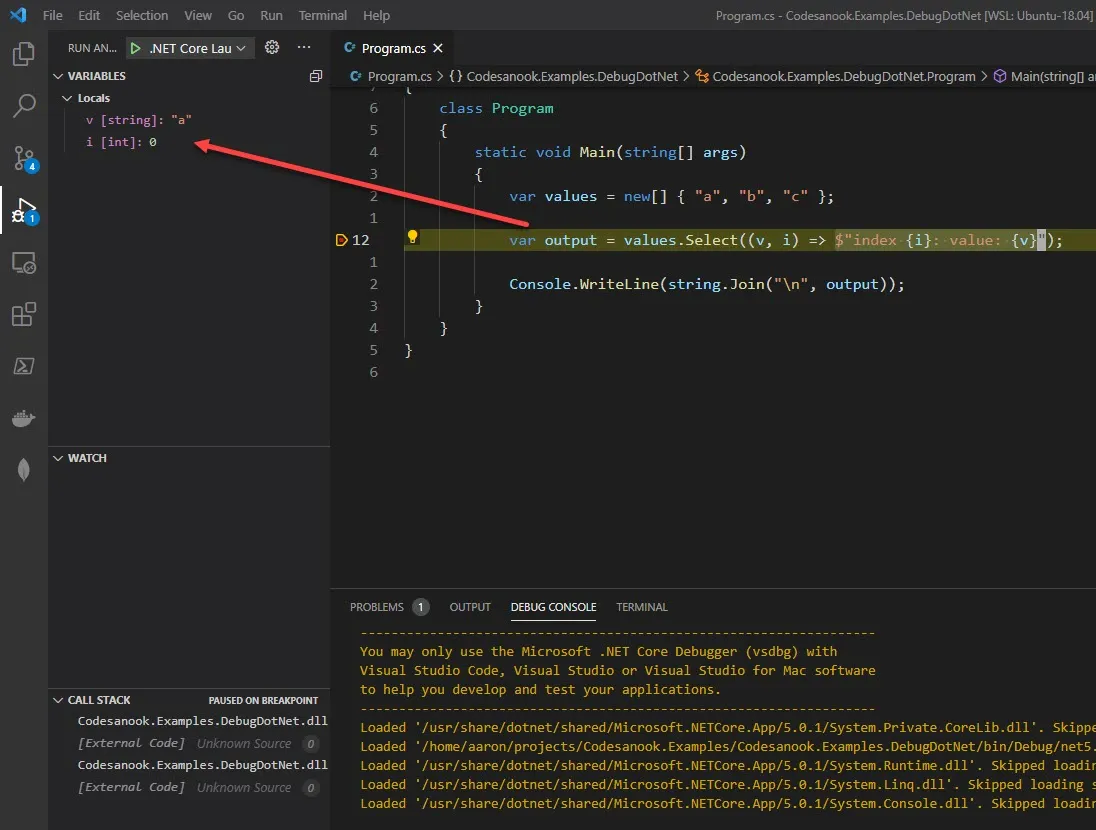
A program will be launched and pause on a line that you put a breakpoint.
-
You can inspect current values of variables in variable window, add variable to watch and see call stack.
Debug with an external terminal WSL2
-
If we set
"console": "externalTerminal"option in launch.json, we will getUnable to launch debugger worker process (vsdbg) through the terminal. spawn xterm ENOENTerror message. -
We can use
dotnet runin an external terminal to run our .NET project and then attach a debugger. -
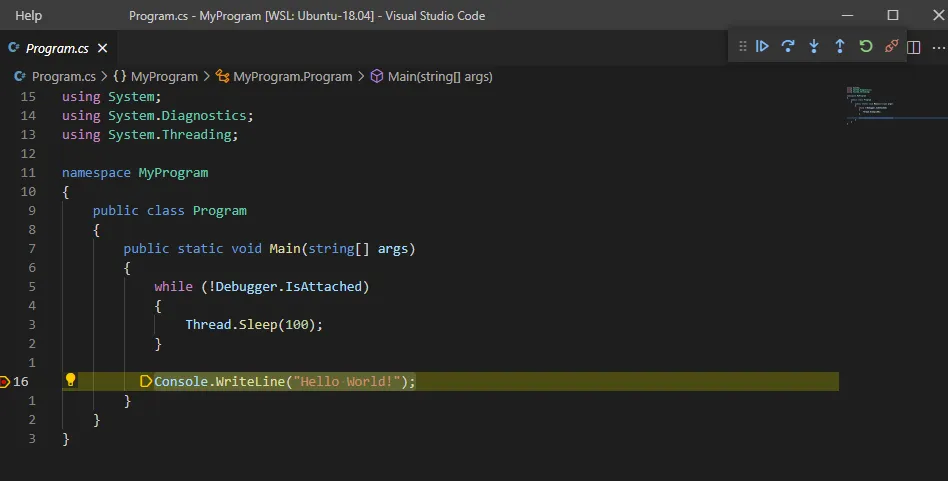
For a console app, we may need to add checking
Debugger.IsAttachedat the beginning of the main method as the following code:public static void Main(string[] args){while (!Debugger.IsAttached){Thread.Sleep(100);}} -
Add
.NET Core Attachconfiguration to launch.json file.{"version": "0.2.0","configurations": [{"name": ".NET Core Attach","type": "coreclr","request": "attach"}]} -
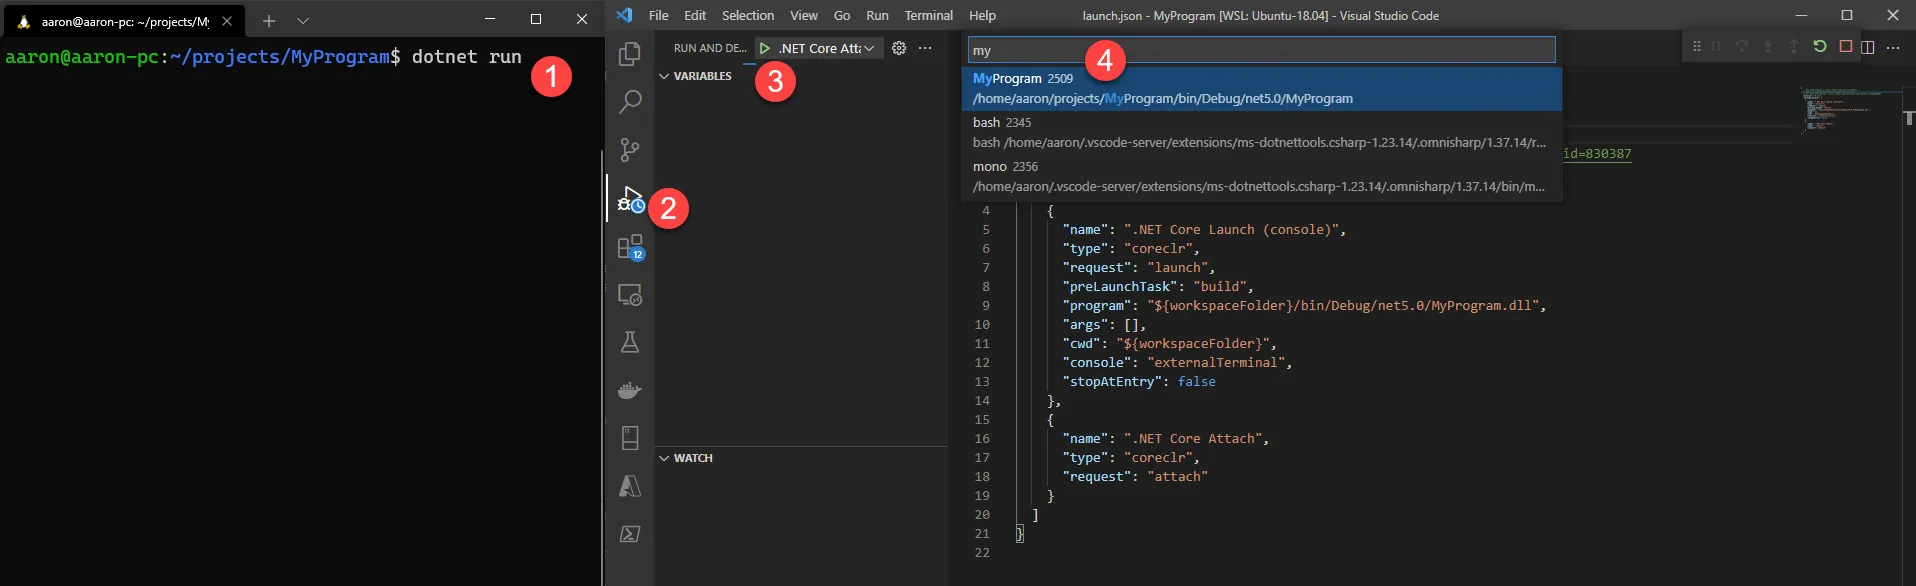
In an external terminal, CD to the root of our project and execute
dotnet run.Terminal window $ dotnet run -
Go back to VS Code. Put a breakpoint to a line that you want a pause a program.
-
Click Debug icon.
-
Change to .NET Core Attach configuration.
-
Click Start Debugging button or press F5.
-
Select a process that has a name matches to our project name.
-
A program has been paused at a breakpoint and we can now start debugging, inspecting a value.